Which dip do you buy?
Everyone buys the dip, but everyone defines the dip differently. These are the three dips I trust right now, on three different timeframes, and how I'll know if they work.
Read this first
I have about 10 finished trades. My regime filter has only been tested since 2026-10-14. And my adherence to my own principles is weak right now.
Part of why this site exists is to make me more consistent. It's a living process journal and a glossary. What follows is how I think now and what I'm testing. It is not proven.
The chart frame
Everything below uses the same small set of lines:
- Daily chart: the 8 EMA, the 21 EMA and the 50 SMA.
- Weekly chart: the 200-week VWMA.
- The regime check: where SPY and QQQ sit against their daily 8, 21 and 50, under test since 2026-10-14. When it says stand down, I don't put on new short-term risk in individual stocks.
Each of these terms is explained where it first comes up below, and on the moving averages page.
What a dip is
Price is fractal. The same shapes show up on a 5-minute chart, a daily chart, and a weekly chart. So "buy the dip" doesn't mean much until you say which dip, on which chart.
Everyone defines it a little differently. Common ones:
- A pullback to a key moving average. A moving average is the average closing price over the last N bars, redrawn every bar. More on the kinds here.
- A pullback to a prior swing high, the top of an earlier push that price broke above.
- A pullback to a prior swing low, the bottom of an earlier dip. That includes a Wyckoff spring: price breaks below a swing low, then reclaims it. That's still a dip.
- A pullback to a symmetry level, like a Fibonacci retracement. That's a tool that measures how much of the last move has been given back, at fixed percentages (38.2%, 50%, 61.8% and so on).
- Countless others.
Levels are a dime a dozen
My core belief: it doesn't really matter what your levels are, as long as you're consistent in how you measure them and how you execute on them.
Anyone can draw a level. The question is which ones you can trust. Whether any of this "works" is its own argument, and I'll write that one separately.
For me, the level I trust depends on the timeframe and the kind of trading. I have three.
Dip 1: the 200-week VWMA (my long-term account)
This is for high-conviction stocks, and sometimes ETFs, that pull back to the 200-week VWMA. VWMA means volume-weighted moving average: weeks with more volume count more in the average. On a weekly chart, 200 weeks is about four years.
I keep seeing quality names trade around this level. The idea is inspired by a famous quote attributed to Charlie Munger:
If all you ever did was buy high-quality stocks on the 200-week moving average, you would beat the S&P 500 by a large margin over time. The problem is that few human beings have that kind of discipline.
The volume weighting is my addition. Over a period that long there are big pockets of high and low volume, and they shift where the long-term average prints. Weighting by volume is one more piece of validation that the line means something.
How I buy it
I prefer the first touch from above: a stock that has traded well above the line comes down into it for the first time. That tends to give a really nice bounce.
I'm also fine buying great names below the line. I view that as deep value. More on that on the deep value page.
The process
Around the 200-week VWMA I draw ±1 standard deviation bands. A standard deviation band sits a set distance above and below the average, based on how far price usually strays from it. Most of the time price stays between the bands.
- First buy: a stock trading well above the 200 comes into it. I'm looking for a retest of the +1 SD band above.
- Add: at the -1 SD band. If both buys are the same size, my average lands around -0.5 SD.
- Trim: once I have a full position, I take 1/3 to 3/4 off at the underside of the weekly 200. A trim is selling part of a position. I assume price will be rejected there and go lower.
- Protect: after the trim, the stop goes to breakeven, my average price, so the rest can't turn into a loss. Then I trail the stop up under obvious swing lows for as long as possible. See partial profits and break-even and trailing stops.
An example that failed: NKE
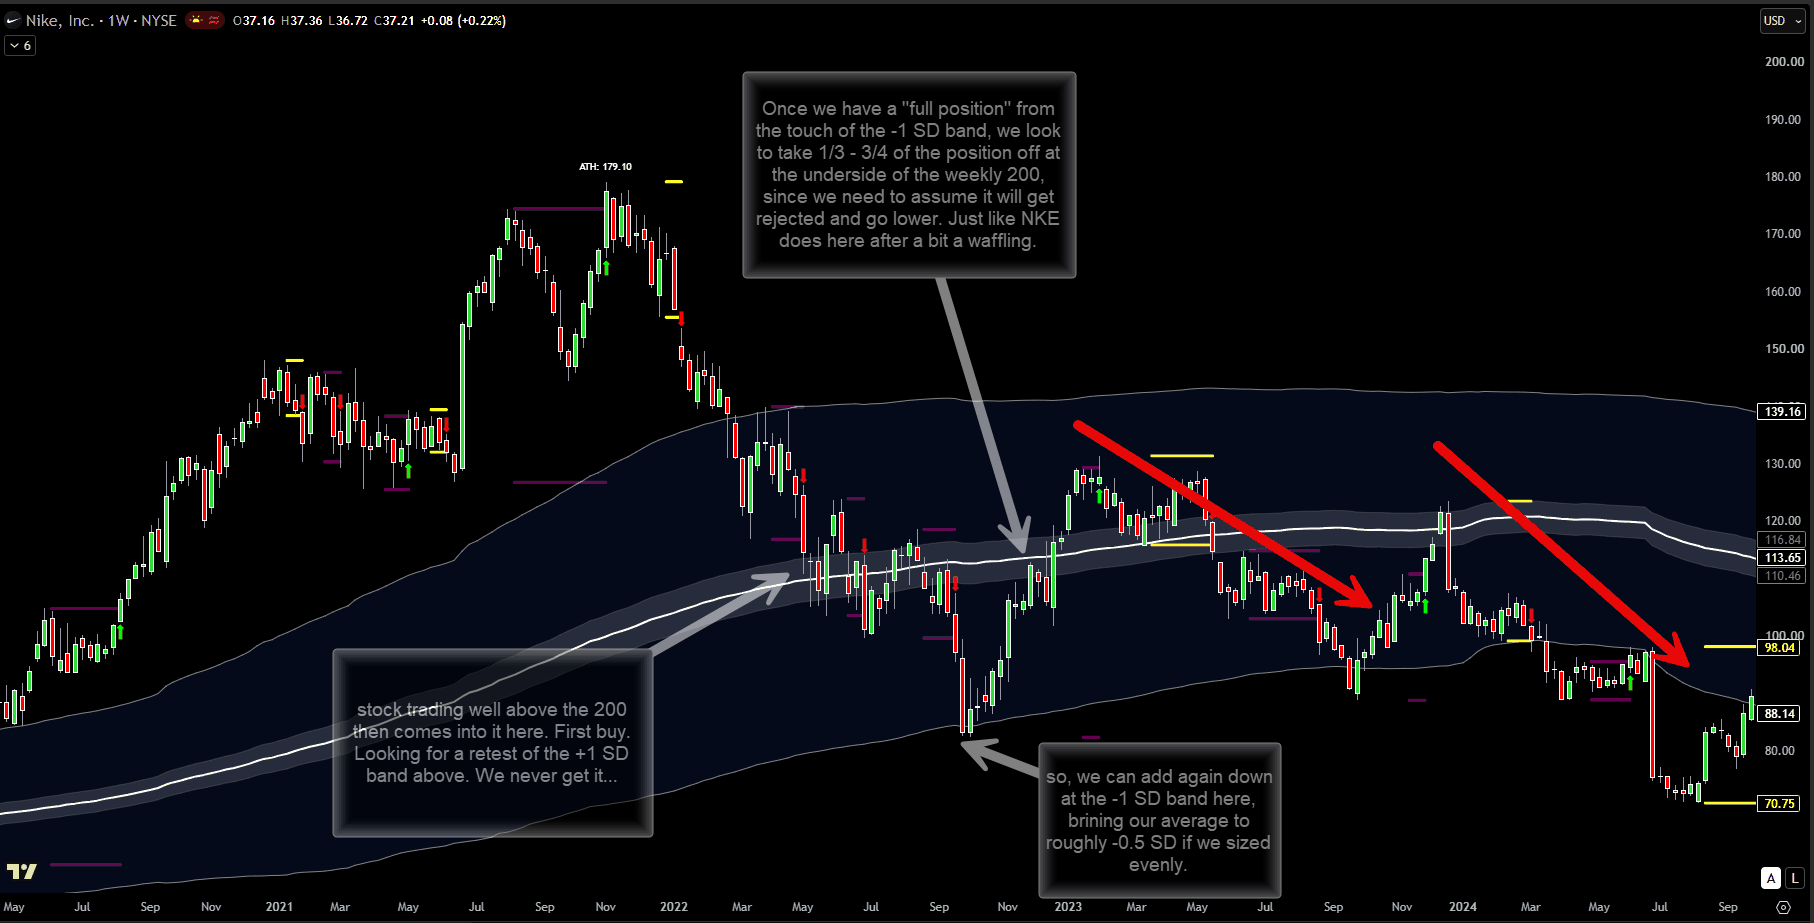
NKE, weekly. My annotations. This is a chart example, not a trade in my record.
NKE was a valid first buy under these rules. It came into the 200 from well above. It never reached the +1 SD band. It made the -1 SD add, rallied back to the underside of the 200 in 2023, got rejected there, and kept falling. It's now about 46% below the line.
Holding all of it would have hurt. The trim at the underside and the breakeven stop on the rest are what protect you. In this example I'd have taken about half off there.
Sometimes it works, sometimes it doesn't
From weekly TradingView data, some times price met the 200-week VWMA:
| Stock | Week of | What happened |
|---|---|---|
| ISRG | 2023-10-16 | Up 96% over the next 52 weeks |
| CRM | 2023-08-07 | Up 53% |
| CRM | 2024-05-28 | Up 57% |
| NKE | 2017-08-21 | Up 55% |
| PYPL | 2022-01-24 | Broke the line the next week, fell as far as 61% below by Oct 2023, never recovered |
| NKE | 2022–23 | Lost the line, about 46% below now |
Sometimes it works and sometimes it doesn't. The plan has to cover both.
Dip 2: the 8 EMA (my short-term trading)
This is for stocks in hot sectors or groups that pull back to, or near, the 8 EMA on the daily chart. EMA means exponential moving average: recent bars count more, so it turns faster than a simple average. I'm looking for continuation, to ride the trend.
The best entries are:
- Near an inside day, or two. An inside day is a day whose high and low both sit inside the prior day's range. The stock is resting.
- Where the prior day's low was undercut and price rallied back into that day's range.
In a bullish regime, pullbacks to the 8 EMA are buyable as long as the prior day closed above the 8. The full setup is on the pullback page.
Why the 8
To me the 8 is a line in the sand for short-term momentum. For price to go higher, it first has to get above its 8 EMA.
Others use similar short lines: a 9 EMA, or a 10 SMA (simple moving average, every bar counts the same). Brian Shannon, a well-known trader, uses the 5-day SMA. I pick the 8 because it's commonly used by traders and algos (algorithms, meaning computer programs that trade automatically), and because it comes from the Fibonacci sequence.
Short term precedes long term. So I use the daily chart for short-term swings and the weekly chart for long-term trades.
Dip 3: the index Fibonacci pullback (QQQ and SPY only)
This one is only for QQQ or SPY, and only when the daily 21 EMA has a solid cushion above the 50 SMA.
"Solid" is a judgment call, built from staring at thousands of charts. To anchor it: recently QQQ's 21 sat about 2% above its 50. That's a decent cushion. SPY's sat about 0.3% above. That's too thin. That's my current read from two examples, not a proven threshold. Why the cushion matters is in the regime filter.
Drawing it
I draw a Fibonacci retracement from the most obvious swing low to the swing high. The most obvious swing low is usually the one that undercut another low, or a series of lows, before price rallied.
I buy the pullback to the 38.2% and 50% levels.
How I express it
I use options here. A call is a contract that gains value when the price goes up. A put gains value when the price goes down. The price you pay for an option, or collect when you sell one, is the premium.
Which kind of trade depends on IV Rank, which compares current implied volatility (how much movement option prices are pricing in) to its range over the past year, on a 0 to 100 scale.
- IV Rank above 30: I sell put credit spreads. A credit spread sells one option and buys a cheaper one further away, so you collect premium up front and has a capped maximum loss.
- IV Rank below 30: I buy calls or call debit spreads. A debit spread buys one option and sells a cheaper one further away, so you pay premium up front for a capped gain and a capped loss.
Getting out
- Targets: I draw a second Fibonacci from the latest swing high down to the low of the pullback. I take profits at the opposing 50% and 61.8% levels.
- Sizing: big enough that I can take 1/4 to 1/2 off at the opposing 50%.
- Then: stop to breakeven, and trail the rest as long as I can, usually with the 8 EMA as the line in the sand.
- Stop: 1 to 2 closes below the original 61.8% level, or size the options so the max loss is appropriate for the account.
Results here are in R, the amount I risk on a trade. A +2R winner made twice what I risked. A -1R loser lost exactly what I planned to lose. See R-multiple.
What my record says so far
Two trades in the record came from the long-term dip:
- CRM (trade 5): a deep-value entry around the 200-week VWMA. +3.45R.
- ISRG (trade 3): deep value that turned into a Fibonacci pullback. +1.48R.
In August 2026 both were bought below the line, about 8% to 15% under, and both later reclaimed it.
Here's the honest part. Both were taken while my own regime filter said stand down. I think that shows the long-term setup runs on a different clock from the short-term filter.
And the reverse happened too. Losers like SKHY (trade 14), HTFL (trade 13) and PLTR (trade 1) came on days the filter said go. A green light isn't a guarantee.
Two winners and a handful of losers is not a sample. It's a start. That's why I'm sticking with one system until it's consistent.
What I'm watching to know if this works
- Index pullbacks: when QQQ or SPY has a cushion around 2% between the 21 and the 50, does the 38.2% to 50% zone hold? And when the cushion is thin, like SPY's 0.3%, does it fail more often?
- The 8 EMA: do 8 EMA continuation entries beat my other entries, measured in R?
- The 200-week trims: when I trim at the underside of the 200 and move the stop to breakeven, does it protect capital the way the NKE chart suggests?
- Two clocks: do long-term buys taken while the filter says stand down keep working, and do short-term trades taken on green-light days keep losing like SKHY, HTFL and PLTR did?
- Me: do I follow these rules the way they're written? If I don't, none of the other answers mean anything.
Trades mentioned
Concepts & rules in this piece
- Deep value: buying quality near the 200-week VWMAA high-conviction stock comes down to its 200-week volume-weighted average. Buy the first touch, add at the lower band, trim at the underside of the line, then protect the rest with a breakeven stop.
- Market regime filter (SPY & QQQ)Before buying individual stocks, check SPY and QQQ against their 8, 21, and 50-day averages. When they're below, stand down or only trade the indexes. When the 21 sits close above the 50, don't buy pullbacks.
- Moving averages: the 8, 21, 50, and 200-weekA moving average smooths price into a trend line. Four of them do most of the work in this record: the daily 8 EMA, 21 EMA, 50 SMA, and the 200-week VWMA.
- One system until it's consistentEvery system has drawdowns. Hopping to a new one each time the current one hurts guarantees you never learn any of them. Get one consistent first, then build.
- Pullback in an uptrendA strong stock dips back to its rising 8 EMA and holds. Buy the hold, stop under the day's low, trim into the next push.